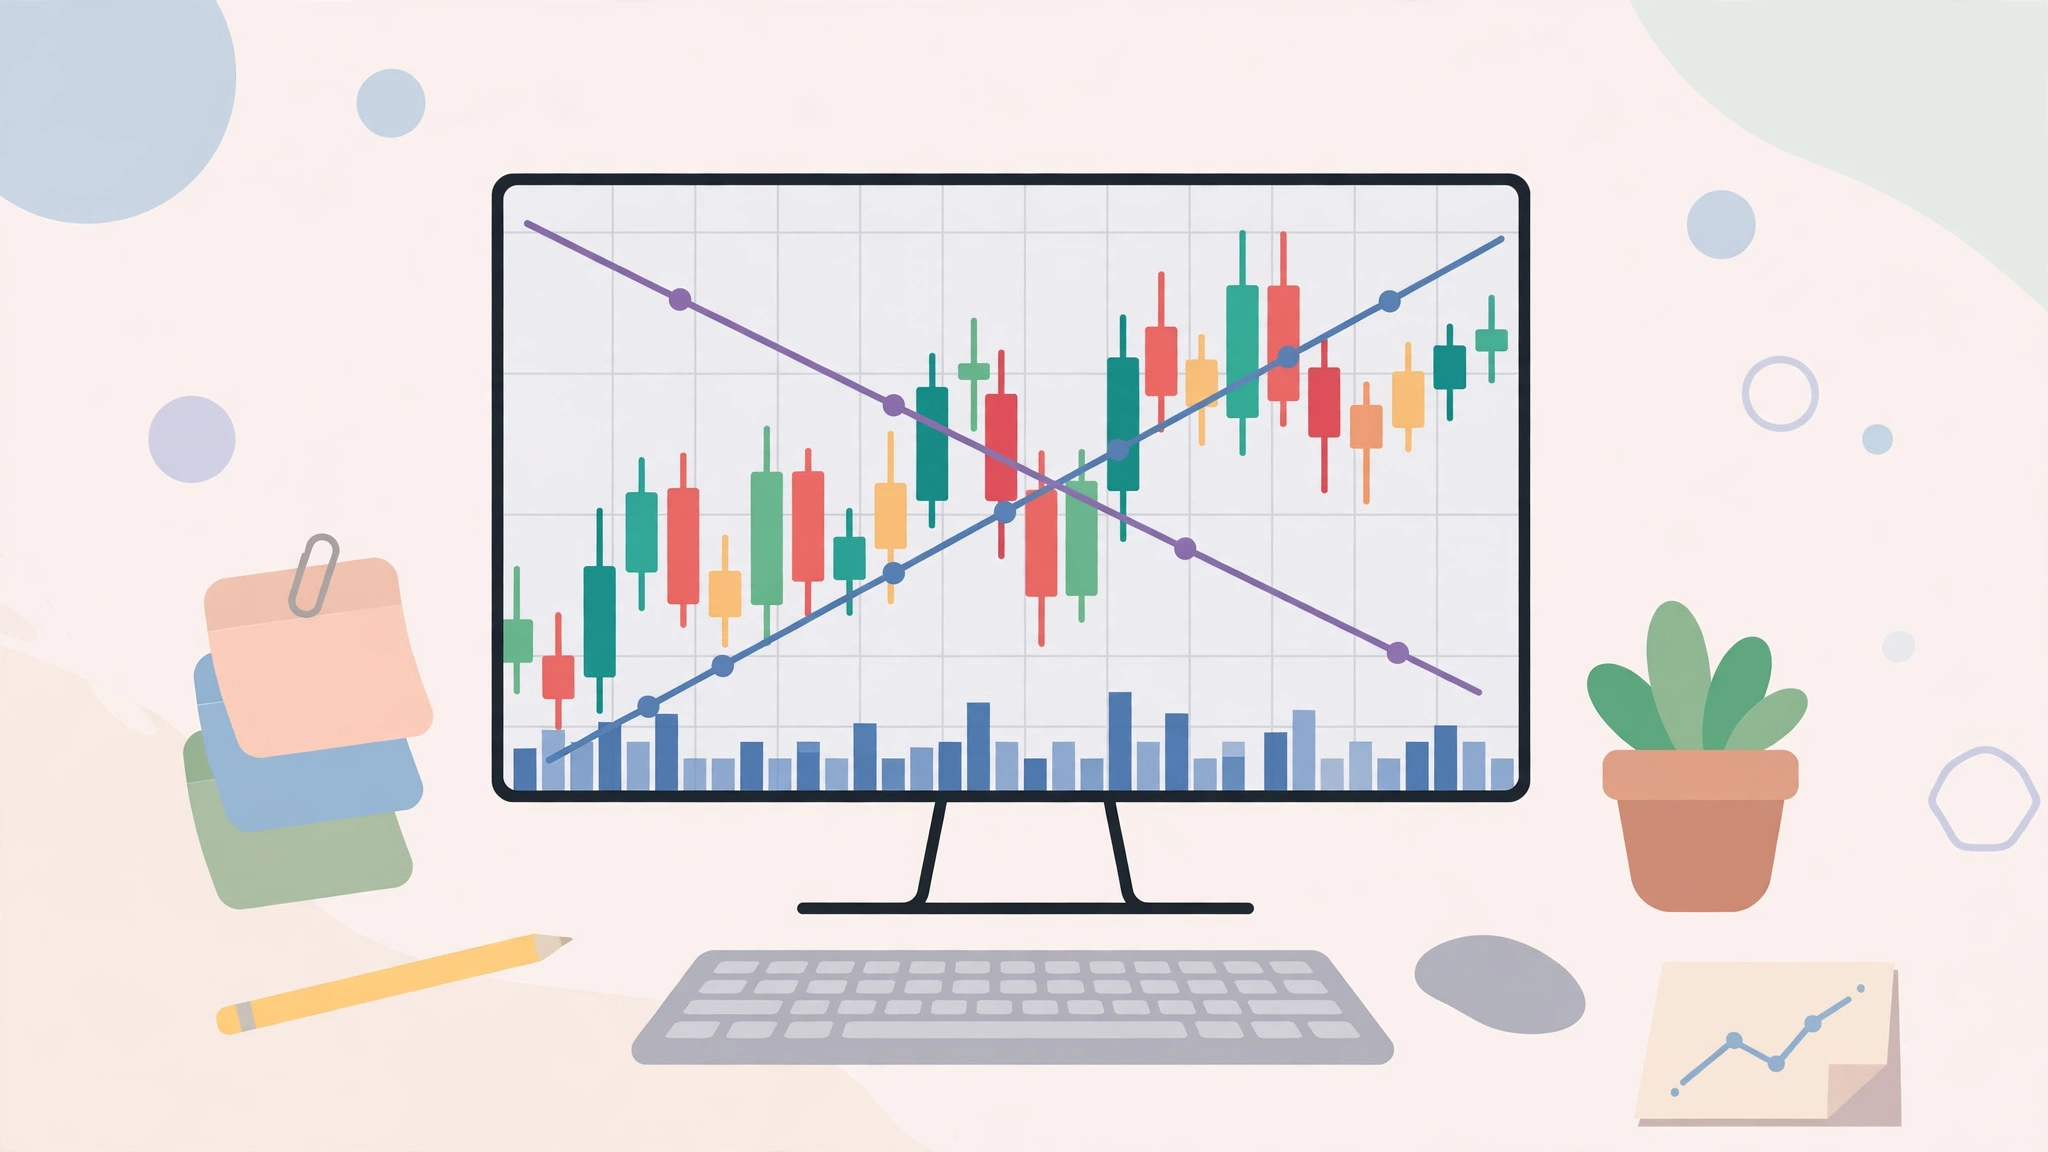
Open any crypto exchange and the first thing you see is a chart full of red and green candles, lines, and numbers. It looks like the control panel of a spaceship — but the basics are far simpler than they appear. Learning how to read crypto charts will not turn you into a fortune teller, and no chart can predict the future. What it can do is help you understand what price has done, where buyers and sellers have clashed before, and whether you are looking at calm waters or a storm. This beginner’s guide covers the essential building blocks — nothing more exotic than candlesticks, timeframes, volume, and a few honest habits.
The Anatomy of a Price Chart
Every price chart shows the same two things: price on the vertical axis (usually on the right) and time on the horizontal axis (along the bottom). As time moves right, the line or candles trace what the asset’s price did. That is genuinely all a chart is — a picture of price history. Everything else is a way of reading that picture more clearly.
You will usually see the asset’s name and trading pair (for example, BTC/USDT, meaning bitcoin priced in a dollar-pegged token), the current price, and its percentage change over the selected period. Green means the price rose during that period; red means it fell. Get comfortable simply identifying these elements before touching any indicators.
Timeframes: Choosing Your Zoom Level
The same market tells different stories at different zoom levels. A timeframe is the amount of time each candle on the chart represents. On a 1-minute chart, every candle covers one minute — a jittery, noisy view used by very short-term traders. On a 1-day chart, each candle covers a full day, smoothing the picture into something a long-term holder can interpret calmly.
Common timeframes include 15 minutes, 1 hour, 4 hours, 1 day, and 1 week. Beginners are usually best served by the daily and weekly charts: they filter out the random flickering and reveal the actual trend. A useful habit is checking two zoom levels — the weekly chart to see the overall direction, then the daily chart for detail. If the two disagree, that itself is information: the market is unsettled.
Candlesticks: The Chart’s Alphabet
Most crypto charts use Japanese candlesticks, where each candle summarizes four numbers for its period: the open, the close, the high, and the low.
Anatomy of a single candle
The thick part is the body, spanning from open to close. The thin lines above and below are the wicks (or shadows), reaching to the highest and lowest prices of the period. If the candle is green, the price closed higher than it opened, so the close sits at the top of the body. If red, it closed lower, and the close sits at the bottom.
What candle shapes whisper
- Long green body: buyers were in control for most of the period.
- Long red body: sellers dominated.
- Long upper wick: price climbed but was pushed back down — buyers tried and failed.
- Long lower wick: price fell but recovered — sellers tried and failed.
- Tiny body with wicks both ways (a “doji”): a standoff; neither side won the period.
Single candles mean little on their own. Meaning comes from context: where the candle appears, what came before it, and how much trading volume accompanied it.
Support and Resistance: Floors and Ceilings
Watch any chart long enough and you will notice prices repeatedly bounce off certain levels, as if hitting invisible floors and ceilings. A support level is a price area where buying has historically stepped in and stopped a fall. A resistance level is where selling has historically stopped a rise. These levels form because humans remember prices: people who missed buying at a low point vow to buy if it returns there, and people who bought at a high point vow to sell if they can just break even.
Two practical rules make these levels more meaningful. First, the more times a level has been tested and held, the more significant it is. Second, levels often swap roles: once price breaks decisively above resistance, that same level frequently becomes support on the way back down. Support and resistance are zones, not exact lines — treat them as neighborhoods, not street addresses.
Volume: How Much Conviction Is Behind a Move?
Below most price charts sits a row of bars showing volume — how much of the asset changed hands in each period. Volume is the chart’s honesty meter. A price rise on high and growing volume suggests broad participation and genuine demand. A rise on thin, shrinking volume is weaker and more likely to fade.
Volume is especially telling at key moments. When price breaks through a long-held resistance level with a surge in volume, traders take the move more seriously than a quiet drift through the same level. Conversely, a scary price drop on very low volume may just be a thin, jumpy market rather than a mass exit. Price tells you what happened; volume hints at how much it mattered.
Trends and Moving Averages
A chart’s most important message is its trend. An uptrend is a series of higher highs and higher lows; a downtrend is lower highs and lower lows; anything else is sideways drift. Drawing a simple line connecting the lows in an uptrend (or the highs in a downtrend) gives you a trend line — a visual reminder of the direction you are swimming with or against.
A moving average smooths price into a single flowing line by averaging the last N periods — the 50-day and 200-day averages are the classics. When price sits above its long-term average, the broad trend is generally considered up; below it, down. When the shorter average crosses the longer one, traders watch closely, though these signals are descriptions of the past, not prophecies. For beginners, moving averages serve one humble purpose: keeping you oriented about which way the river is flowing.
A Simple Beginner Routine for Reading Any Chart
- Start wide. Open the weekly chart. Is the long-term direction up, down, or sideways?
- Move to the daily chart. Does the shorter view agree with the weekly one?
- Mark the obvious levels. Where has price repeatedly bounced or stalled? Draw those zones.
- Check volume. Are recent moves backed by strong participation or thin trading?
- Compare with the moving average. Is price above or below its 200-day line?
- Write down what you see in plain words before making any decision. If you cannot describe the chart simply, you do not understand it yet.
This routine takes five minutes and replaces gut feeling with observation. It pairs well with the calmer, longer-term mindset described in our guide to investing for beginners — charts are one tool in the box, not the whole toolbox.
Mistakes Beginners Make With Charts
The most common error is indicator overload: piling on a dozen oscillators until the chart looks impressive and says nothing. Two or three tools you understand beat twelve you do not. A second mistake is living on tiny timeframes, where random noise triggers constant emotional decisions. A third is treating patterns as guarantees — every pattern fails sometimes, and charts describe probabilities at best. Finally, beware of hindsight: patterns look obvious after the fact. The honest test of any chart reading is what it told you before the move, which is why writing observations down matters.
A Few Patterns Worth Recognizing
Chart readers give names to shapes that recur because human behavior recurs. You do not need a catalog of dozens; three classics teach the underlying idea.
Double top and double bottom
Sometimes price climbs to roughly the same high twice and fails both times, tracing an “M” shape — a double top. It suggests buyers ran out of strength at that ceiling. The mirror image, a “W” shape at the lows, is a double bottom, hinting that sellers exhausted themselves at that floor. Neither guarantees a reversal, but both mark levels the market has effectively voted on twice, which makes them worth watching.
Triangles
When highs keep getting lower while lows hold steady — or the reverse — the trading range squeezes into a triangle. It reflects a standoff that is tightening, with one side gradually giving ground. Traders watch to see which way price finally escapes the squeeze, ideally confirmed by a rise in volume, while remembering that false escapes are common and patience is cheaper than enthusiasm.
The trend itself
The most important “pattern” is not a shape at all but a sequence: rising peaks and rising troughs mean an uptrend; falling peaks and falling troughs mean a downtrend. Beginners often hunt for exotic patterns while missing this basic fact staring at them from the chart. Learn to see the trend first — the named shapes are commentary, not the headline.
Two Indicators You Will Meet Everywhere
RSI: the momentum gauge
The Relative Strength Index (RSI) is a number from 0 to 100 estimating whether recent price moves have been unusually one-sided. Readings above 70 are traditionally called “overbought” and readings below 30 “oversold.” Treat these words as weather descriptions, not commands: in a powerful uptrend, RSI can stay “overbought” for weeks while the price keeps climbing. Its best beginner use is noticing when a move looks stretched compared with its own recent history.
MACD: trend and momentum combined
The MACD compares two moving averages and displays their relationship as lines that cross when momentum shifts. Those crossings attract attention as possible turning signals, but like every indicator, the MACD is built entirely from past prices and therefore lags reality. Use it, if at all, as a second opinion alongside trend, levels, and volume — never as a lone decision-maker. In fact, that advice covers indicators generally: each one is just price data wearing a costume. They organize information; they do not add new information. If an indicator disagrees with the plain story told by trend, levels, and volume, believe the plain story.
This article is educational content, not financial advice. Cryptocurrency is volatile and high-risk, and chart reading cannot predict prices or protect you from losses. Never trade with money you cannot afford to lose.
Frequently Asked Questions
Which timeframe is best for beginners?
The daily and weekly charts. They filter out minute-to-minute noise and show the trends that actually matter to anyone who is not trading full-time. Smaller timeframes mostly teach impatience.
What is the difference between a line chart and a candlestick chart?
A line chart connects closing prices only — clean and simple, but it hides what happened inside each period. A candlestick shows open, high, low, and close, revealing the struggle between buyers and sellers within every period.
Can charts predict crypto prices?
No. Charts summarize past behavior and help you judge trends, levels, and risk, but crypto prices are driven by news, liquidity, and sentiment that no pattern can foresee. Anyone claiming a chart guarantees a future price is not being honest with you.
The Bottom Line
Reading a crypto chart is a learnable literacy, not a superpower. Master the basics — price and time, timeframes, candlesticks, support and resistance, volume, and trend — and you will understand more of what a chart is saying than most people shouting about it online. Use charts to describe what is happening and to manage your own decisions calmly, never as a crystal ball. Start on the daily and weekly views, keep your tools few and understood, and let clear observation replace excitement as your guide.